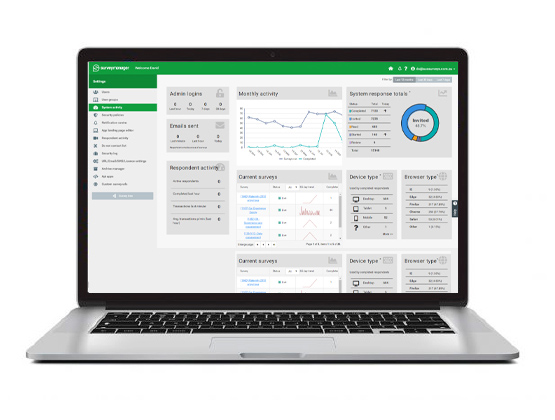
Monitor responses in real-time
Find out how your customers are interacting with your survey.Thanks to the integrated design features of SurveyManager®, it's never been easier to generate and review customer responses in real-time.
Utilise an in-built progress window to provide your administrators with a summary and detailed real-time views of all responses. Features like these enable you to check on the health of your survey whenever you want.
Ever wanted to investigate exactly how your customers interact with a survey? Find out how many people are responding, what sort of device they're using, or at which point they are dropping out from in the survey.
Real-time analytics and survey reports
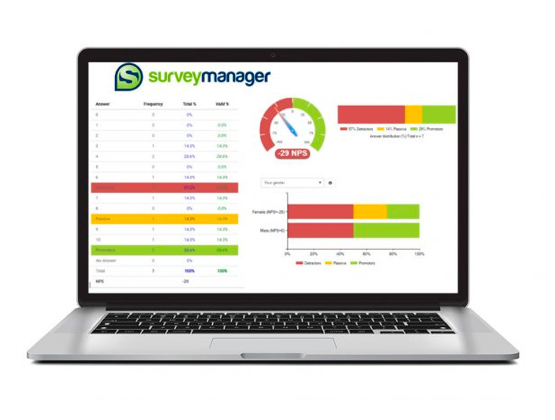
SurveyManager® provides a suite of reports and analytics in real-time, such as:
- Statistical tables, charts, and verbatim answers to all questions.
- Statistical tables for statistical type questions.
- Chart only displays for relevant questions.
- Verbatim display options that show text-only questions.
- Crosstab questions along with relevant crosstab table displays
- Single question displays that include a statistical table and chart.
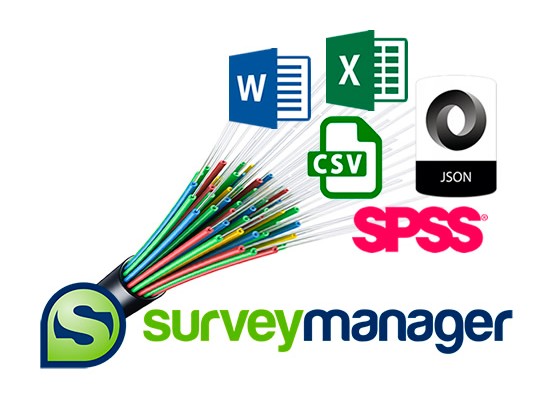
Dashboard API and Data Exports
If you have a dashboard with valuable information, we can export your data via our industry-standard JSON API. SurveyManager® will output the survey data dictionary with question labelling that matches the data file variable labels and codes.
Free text answers can readily be converted to Word files from the CSV output. CSV or Excel formats and fully labelled SPSS data files are also supported.
New integrations now available to Microsoft Power BI and Displayr.
In addition, the survey responses can be co-extracted with other biographical data held in the respondent file, which was not used in the survey but may be used in the analysis of the survey.
Custom reporting
We often produce custom reports within SurveyManager® and these reports can be generated ad hoc from a flexible menu of choices or generated automatically in response to specific business events.
These reports vary from full Word documents containing commentary, graphs, and tables, to 360° reports, to custom customer satisfaction trend reports to esoteric contents such as council waste statistics or occupancy rates of aged care villages.
Outputs can be as Word, Excel, PowerPoint, PDF or a user-friendly dashboard of your choice.
Join the growing list of clients who rely on SurveyManager to power their insights. Request a demo today!


A survey allows you to gather a wide array of data that can provide significant value to your business or organisation, but you need to be able to understand the data for it to be beneficial.
SurveyManager helps you get the most out of your survey data with comprehensive survey analysis and reporting.
Understanding your survey data
Customer surveys can provide a wide range of data, from multiple-choice questions to qualitative answers. You want to make sure that the responses you receive are useful and that you’re able to put them into action.
Survey data can be shown as percentages, statements and opinions from a large group of people. You need to be able to conduct accurate survey data analysis to draw conclusions from the information you’ve gathered.
By understanding what your survey data means, you can understand how to use it to implement improvements and changes within your business or organisation. Identifying patterns can help you figure out key takeaways and determine a general consensus among survey respondents.
Being able to see survey results in real-time allows you to assess if there are any drop off points at which respondents stop engaging. This insight can help you when planning future surveys to ensure you get optimum results and return on your surveys.
With the right analysis and reporting tools, you can draw conclusions from your survey results and develop strategies to implement changes that address your survey feedback.
SurveyManager analytics & reporting features
SurveyManager offers a range of analytic and reporting features to help you understand your survey data. With real-time analytics and survey reports, dashboard API and data exports, and custom reporting options that bring your survey data to life
Our reporting options allow you to visualise your data to identify patterns and understand responses.
Ready to present reports provide focused analytics and real-time snapshots of audience opinion and preferences.
Data collected from surveys can be used to boost employee engagement, understand buyer behaviour and improve customer experiences. Comprehensive survey analysis is important to draw broader conclusions from your audience, which can help you make meaningful business decisions.
With various reporting options and templates, SurveyManager makes it easy to analyse complex data and gain actionable insights.